Week 4 Assignment 8 and 9
- Carter Kawai
- Sep 17, 2022
- 2 min read

Assignment 8: 10 Maps in a Minute
Volcanic Activity Map

First, I searched for Halemaumau Crater in Map Viewer classic.

I added new sentinel layers and used infrared imaging.

Lastly, I added hotspot layers VIIRS and MODIS to the map.
2. Drought Map

USA Drought Intensity Current Conditions Layer added.

Basemap changed to firefly imagery hybrid.
3. Pipeline Map

First I added the pipeline (Petroleum Products Pipelines) layer. Then I filtered out the pipelines to show ColonialPipeline CO. After that, I changed style options to show red and 2.5 pixel width for the pipeline location.
4. Snow Map

First I added the USA weather watches and warnings layer.

After adding the layer, I edited a filter to show winter storm warnings, watches, and advisories.
5. Severe Weather Map

Added USA Weathers Watches and Warnings Layer

Definitely confused but I pretty much just did the same filters as I did on the snow map.

Added Saturate effects to 150 and transparency to 60% + changed basemap to terrain with labels.
6. Flood Map

I added a Live Stream Gauges layer and then added filters to show Minor, Moderate, and Major floods to the map.

This shows the pop-up information for Easter Stump Lake at Lakota ND and an hourly forecast.
7. Smoke and Air Quality

First I added the National Weather Service Smoke Forecast.

The second layer I added is the AirNow Quality Monitoring Site Data (Current).
8. Hurricane Map

First I added the Active Hurricanes, Cyclones, and Typhoons layer. After that, I switched the basemap to Firefly Imagery Hybrid.
9. Fire Map

First I added the USA Current Wildfires layer. After that, I added the Satellite VIIRS Thermal Hotspots and Fire Activity layer.
10. Earthquake map

First I added the recent earthquake layer. After adding that layer, I created a filter to show quake spots of earthquakes that are of 4.0 magnitude or higher.
Assignment 9: Outdoor mapping
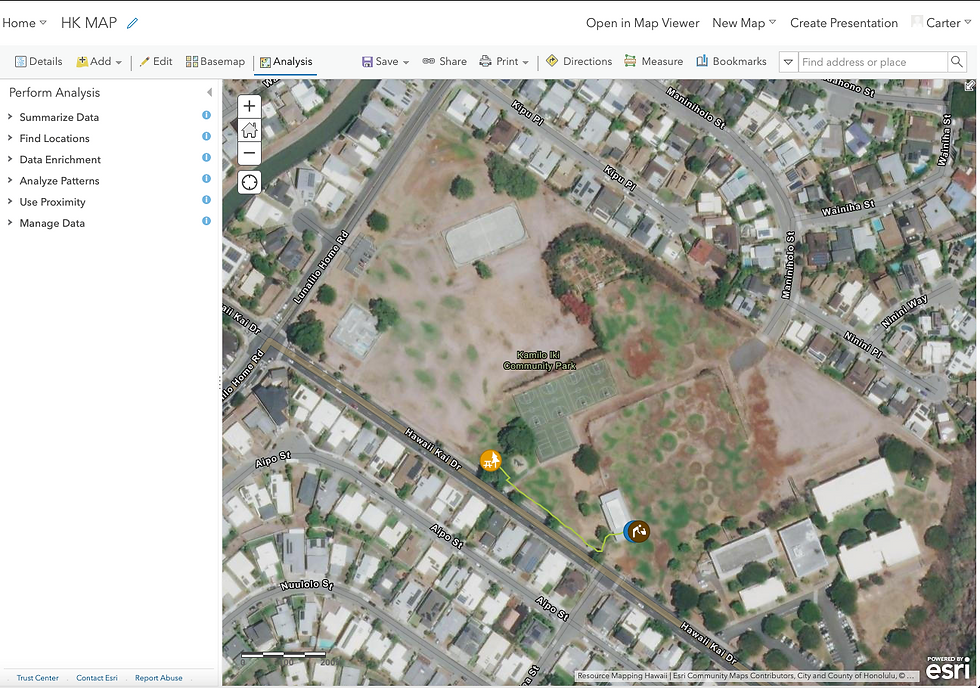
I choose to make a map of Kamilo Iki Community Park which is located about 5 minutes from my home. I used the sidewalk and paved paths to go from the picnic table to the bathroom and water fountain. Link to the map: https://arcg.is/18Pfai - Images for the picnic table, bathroom, and water fountain are included in the map.


Nice work. For each activity, be sure to include some reflections on lessons learned.